WHAT ARE CHARTER PUBLIC SCHOOLS?
Charter public schools are an important part of the Massachusetts public school system. First authorized by the Education Reform Act of 1993, the Massachusetts charter public school sector has grown from an initial cohort of 15 schools in the fall of 1995 to nearly 70 programmatically diverse schools across the state.
Learn MoreCHARTER PUBLIC SCHOOLS HAVE GREATER AUTONOMY
Schools operate under five-year charters granted by the Commonwealth’s Board of Elementary and Secondary Education. Charter public schools have greater flexibility in how they approach key elements of education, including:

Curriculum Design

Staffing

Teacher Leadership

Professional Development

School Culture

The best public education systems support all kids in reaching their full potential, and charter public schools are part of the formula that has given Massachusetts the top-performing public school system in the country. Parents should have the right to decide which public school will best serve the unique needs of their children, whether that be a district, vocational, or charter public school.
In Massachusetts, charter public schools strive to deliver on their commitment to every student by focusing on:
- Teachers and Classrooms
- Results on Behalf of Kids
- The Unique Learning Needs of Children
- Access, Opportunity, and Belonging for All
WHERE ARE CHARTER PUBLIC SCHOOLS IN MASSACHUSETTS?

- Students 46000
- Teachers 3000
- Charters 67
- Gateway Cities 50%
- Boston 20%
- Suburban & Rural 30%
charter public schools serve a diverse student population
*Student population data come from the Department of Elementary and Secondary Education’s School and District Profiles from SY 2025-2026 for all Commonwealth charter public schools.

charter public schools are held to the highest standards
- Assessed for renewal every 5 years by the Massachusetts Department of Elementary and Secondary Education
- Managed by public boards of trustees and subject to annual financial audits
- Governed by the same laws and rules as district public schools
- Highly selective process with only 95 schools approved since 1994
CHARTER PUBLIC SCHOOLS ARE POSITIVELY IMPACTING STUDENTS AND FAMILIES


Students are more likely to meet grade-level expectations*
*This figure shows the percent of students in each group in Grade 10 who met or exceeded expectations on the 2025 MCAS exam. Data comes from the Department of Elementary and Secondary Education School and District Profiles and are based on a comparison of all Commonwealth charter public schools and districts across the state.
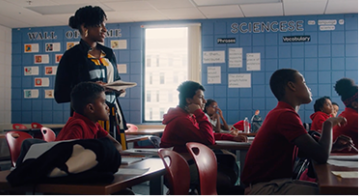
Hear From Our Students, Families, and Teachers
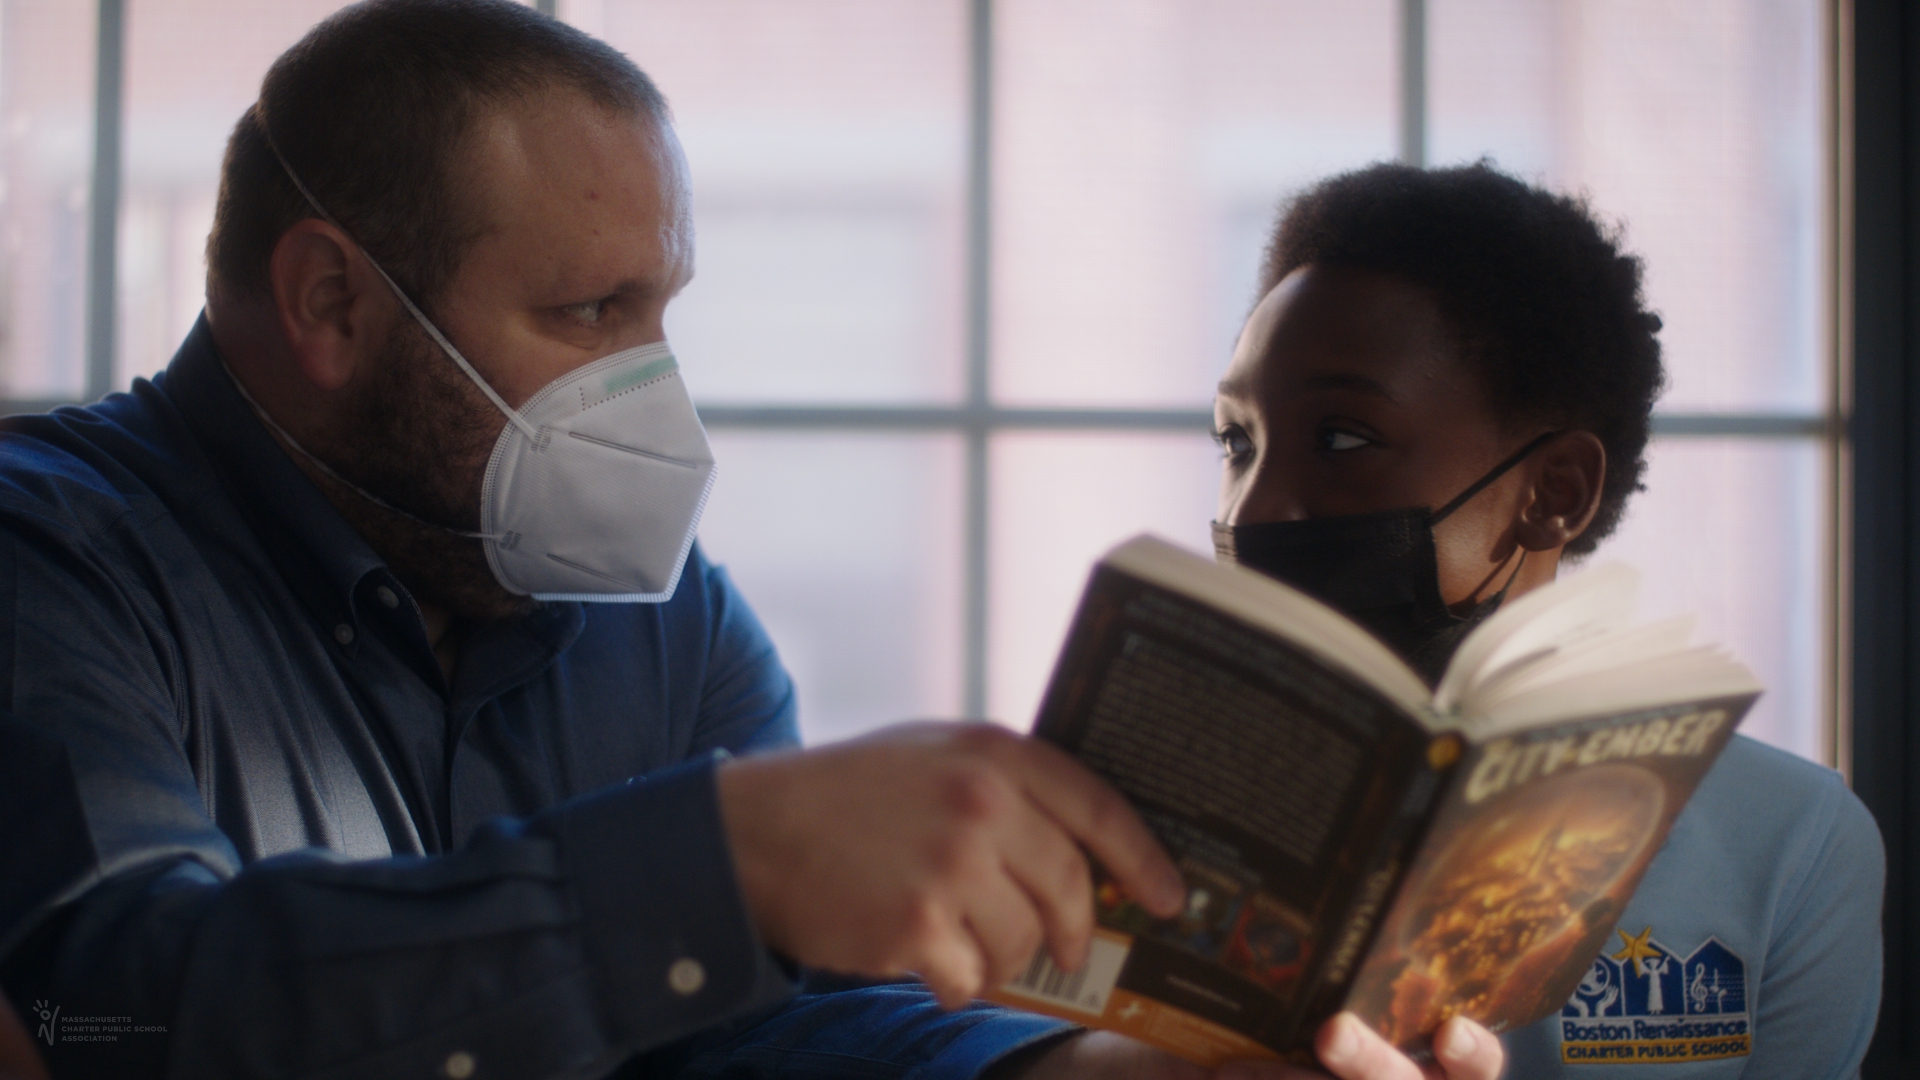
- Aaron Kesler, Teacher at the Boston Renaissance Charter Public School
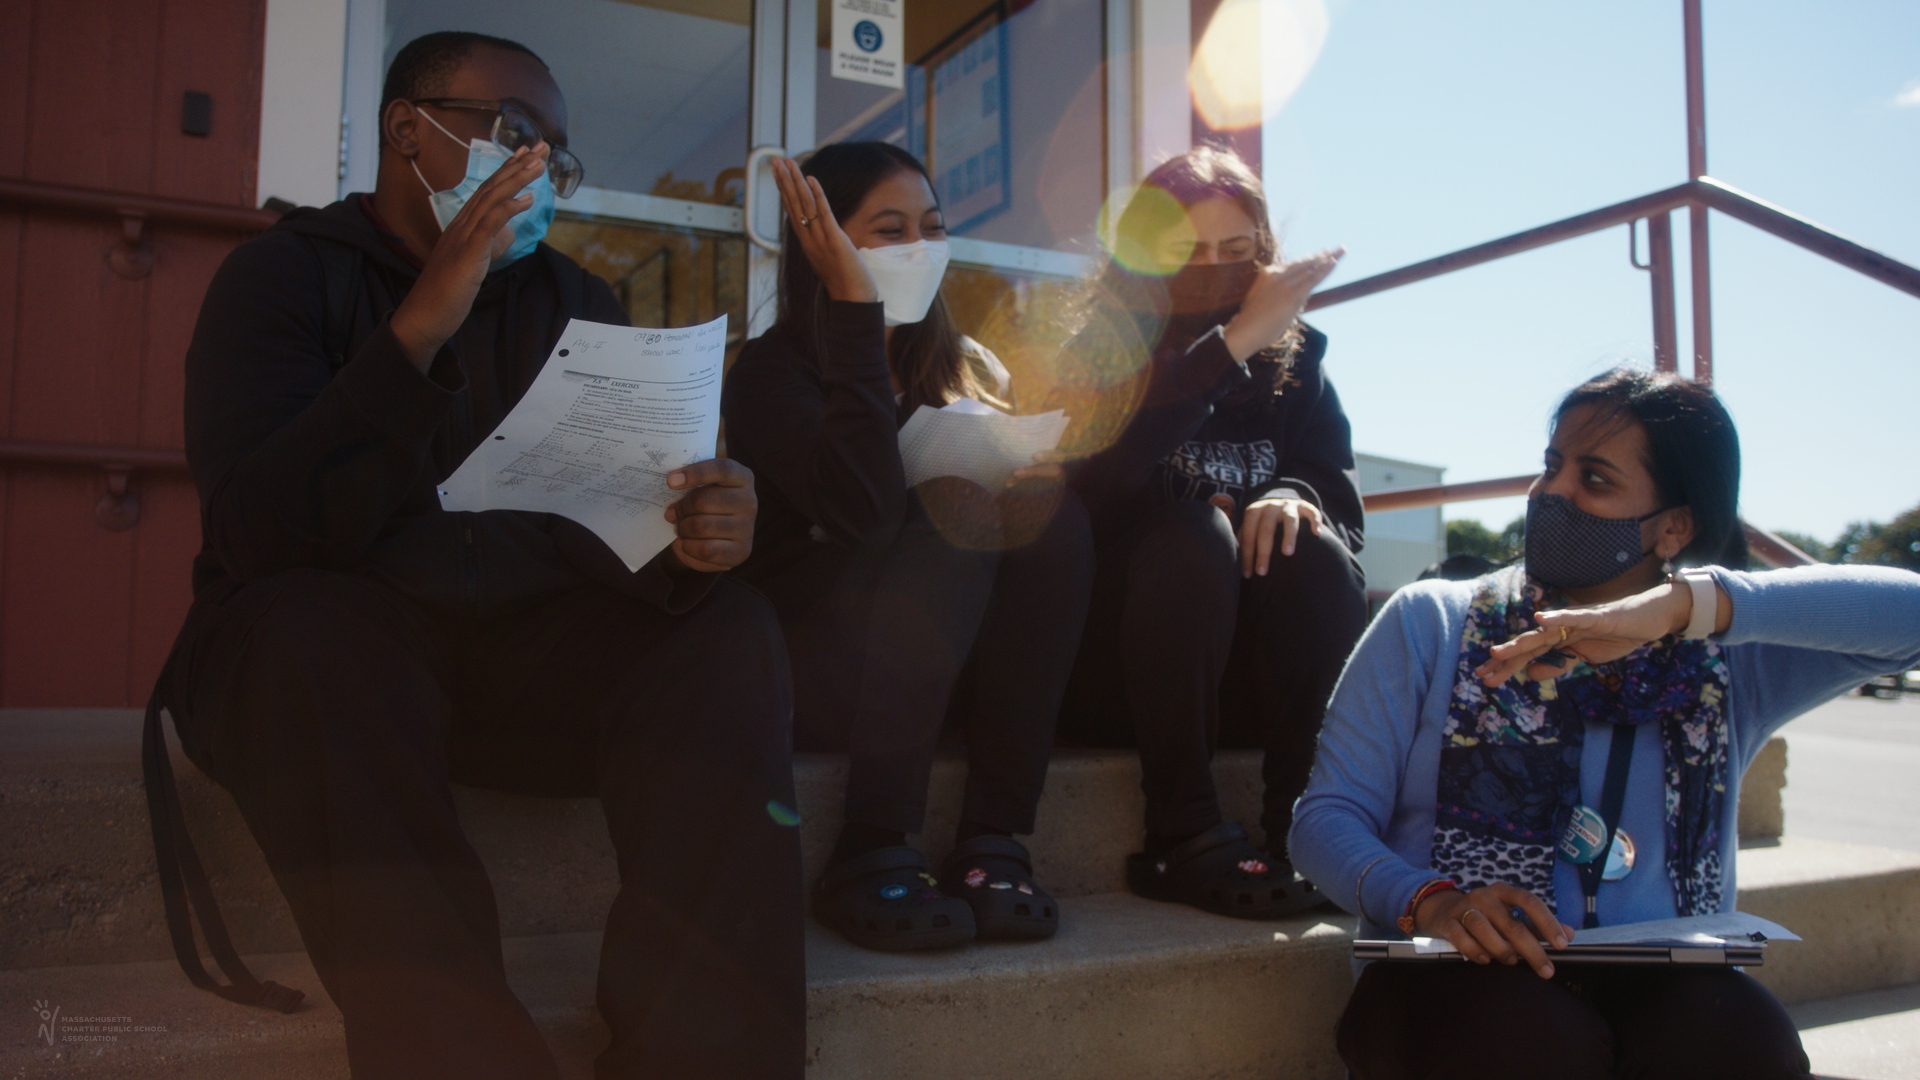
- Siddhi Shukla, High School Math Teacher at Pioneer Charter School of Science II
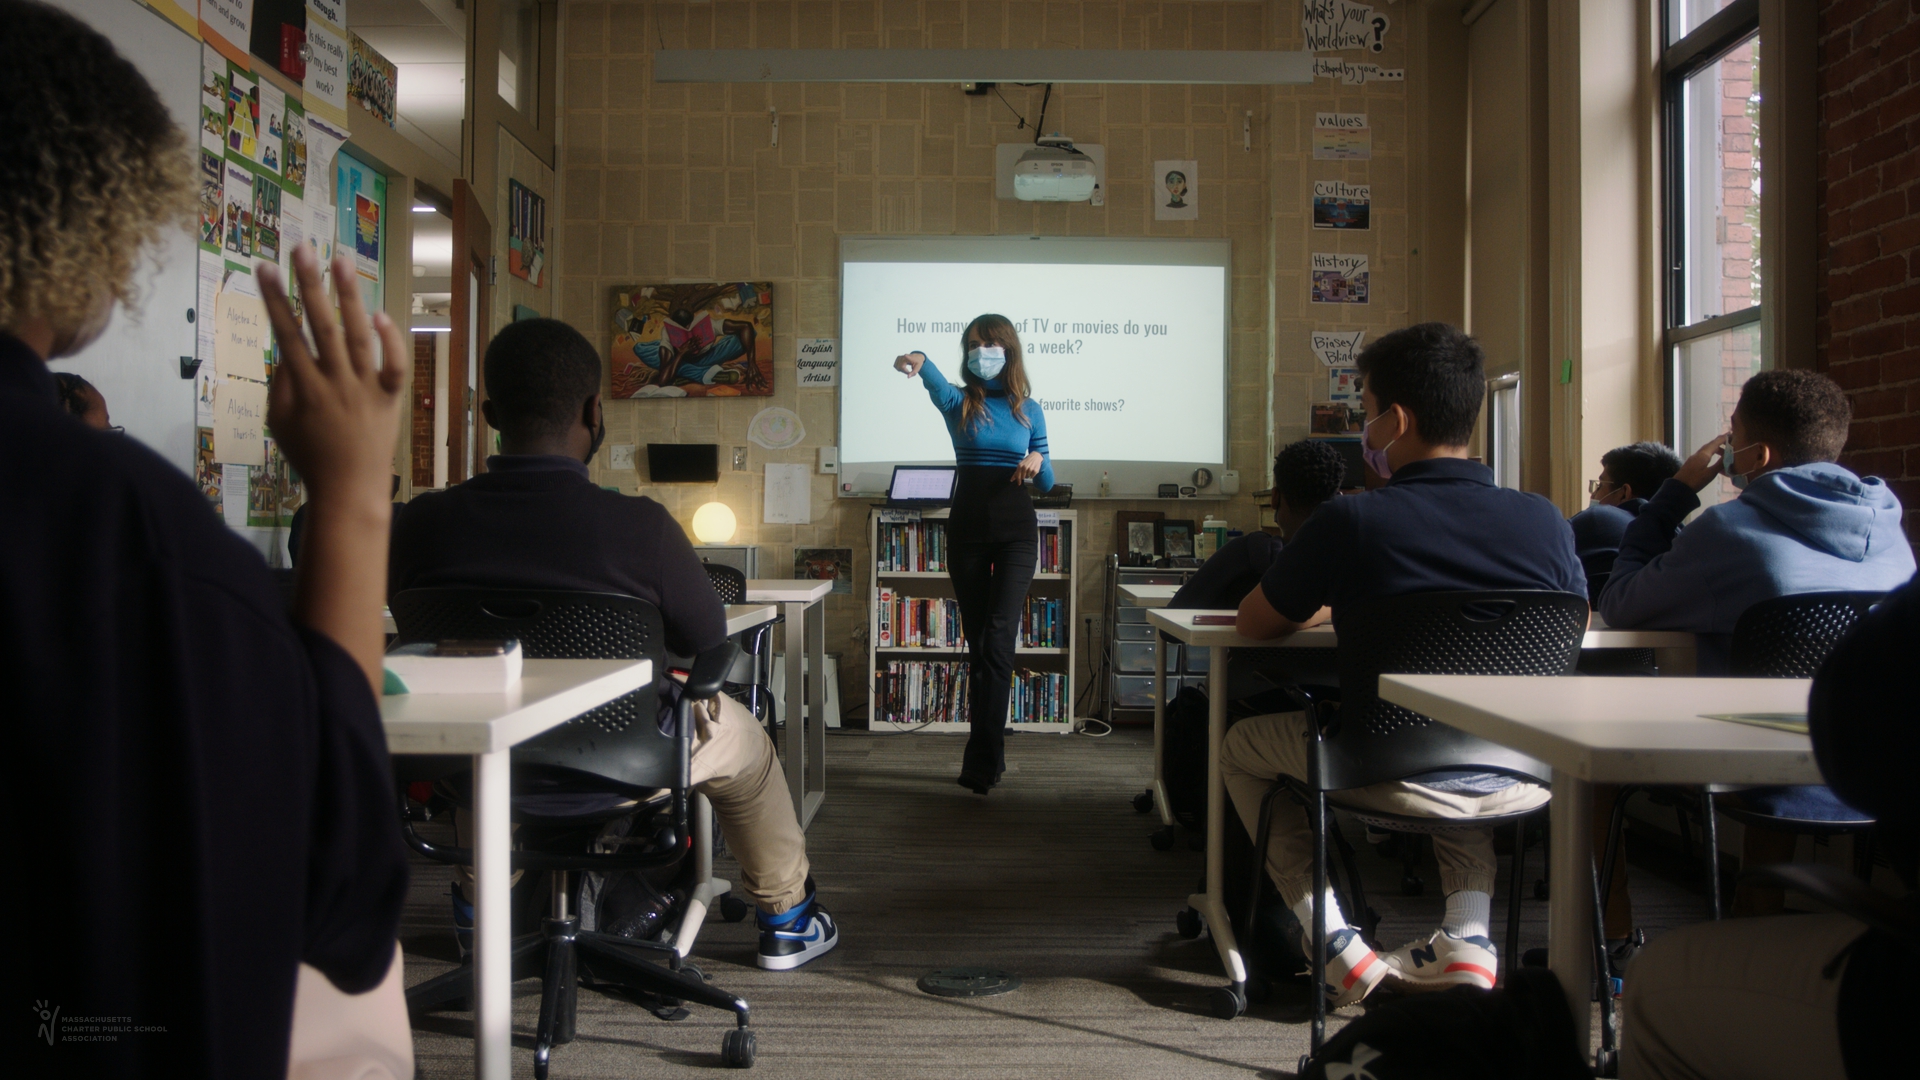
- Rachel Wetschensky, Reading Specialist at Prospect Hill Academy
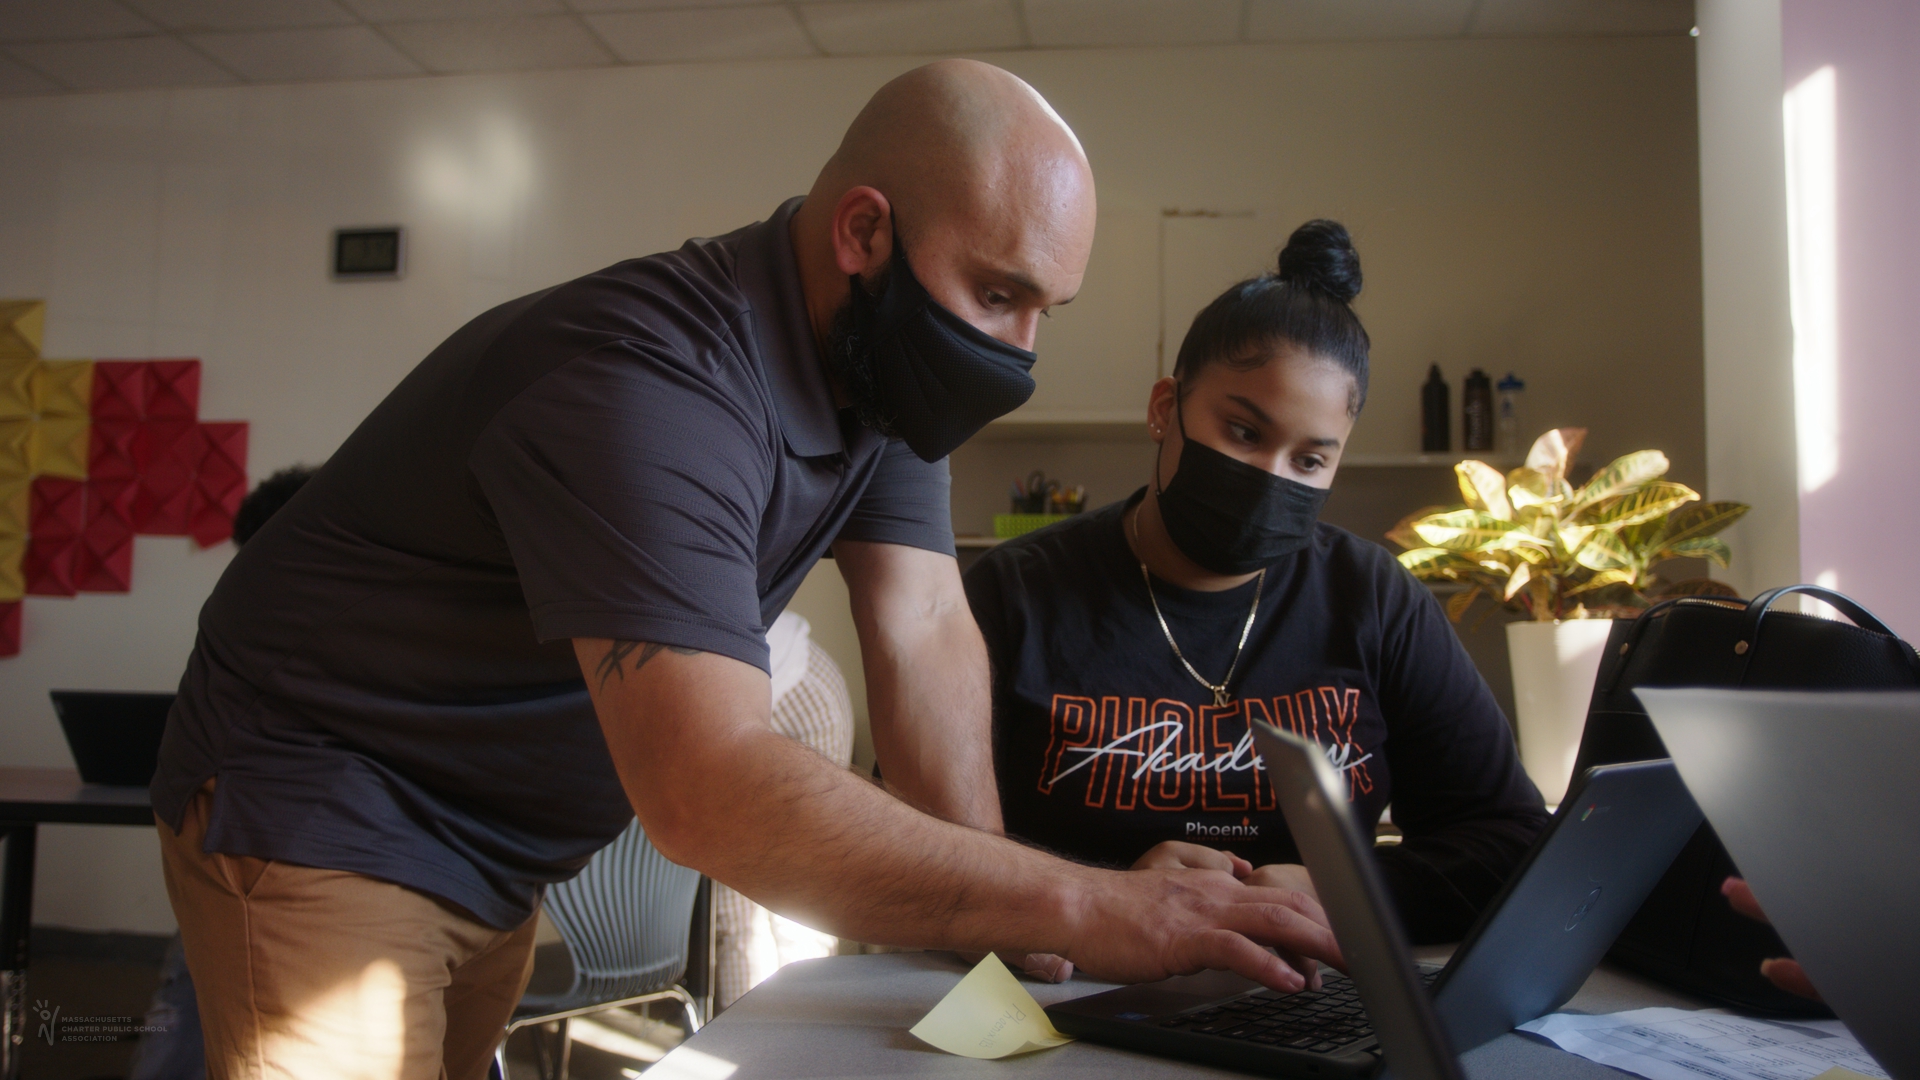
- Michael Caban, Teacher at Phoenix Charter Academy Lawrence
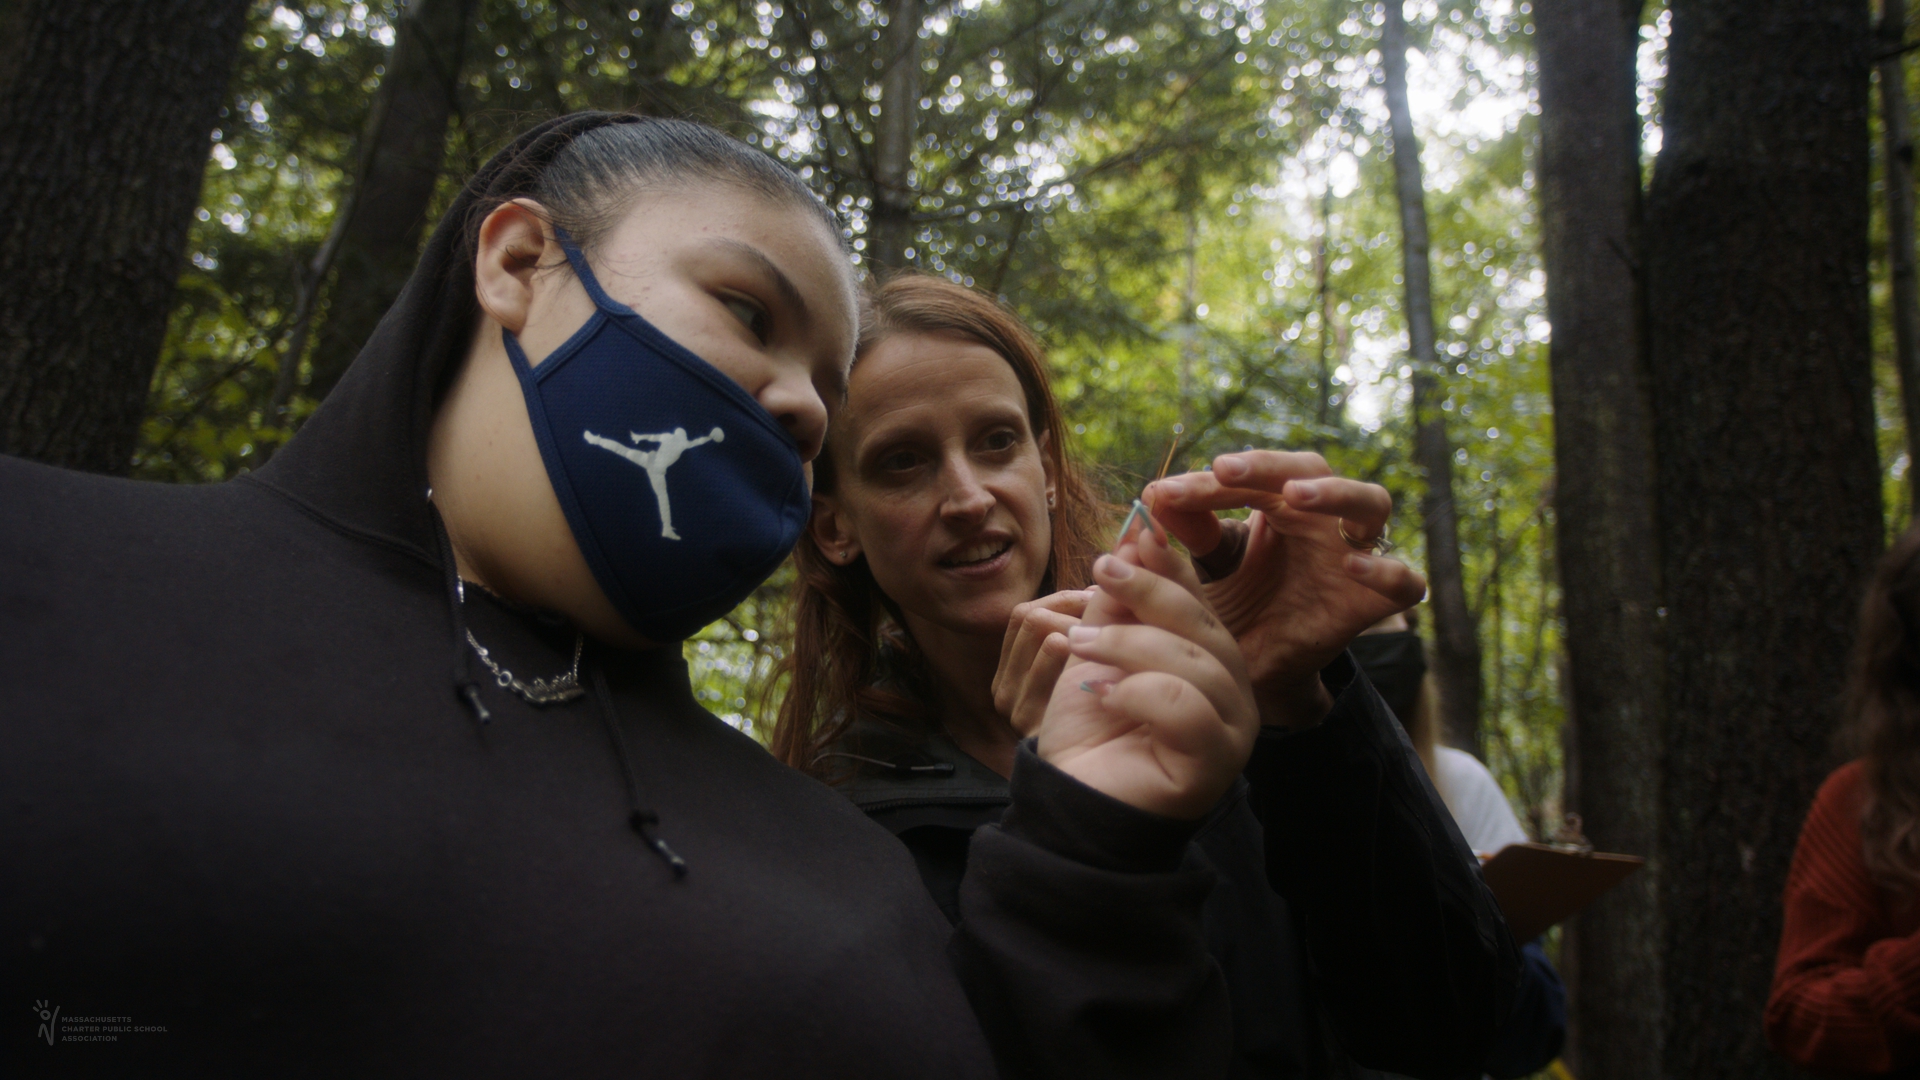
- Katharine Hinkle, Science Teacher at Innovation Academy Charter School

- Deb Merriam, Academic Dean and Parent at Francis W. Parker Charter Essential School